Bengaluru Urban is one of the main contributors to the state’s GDP. But the skew towards the capital city is heavier than one would expect. The state’s GDP for the financial year 2019-20 stands at Rs. 16.16 Lakh Crore of which 5.96 Lakh Crore is from Bengaluru Urban. The city hosts less than a sixth of the state’s population but contributes 37% of the state’s GDP!
This has much larger implications in terms of where Karnataka stands among other states. In terms of per-capita income, Karnataka ranks a healthy fifth ahead of even Tamil Nadu and Kerala. More importantly, it counts among a cohort of states like Tamil Nadu, Kerala, Maharashtra and Gujarat that are recognised as “rich” states.
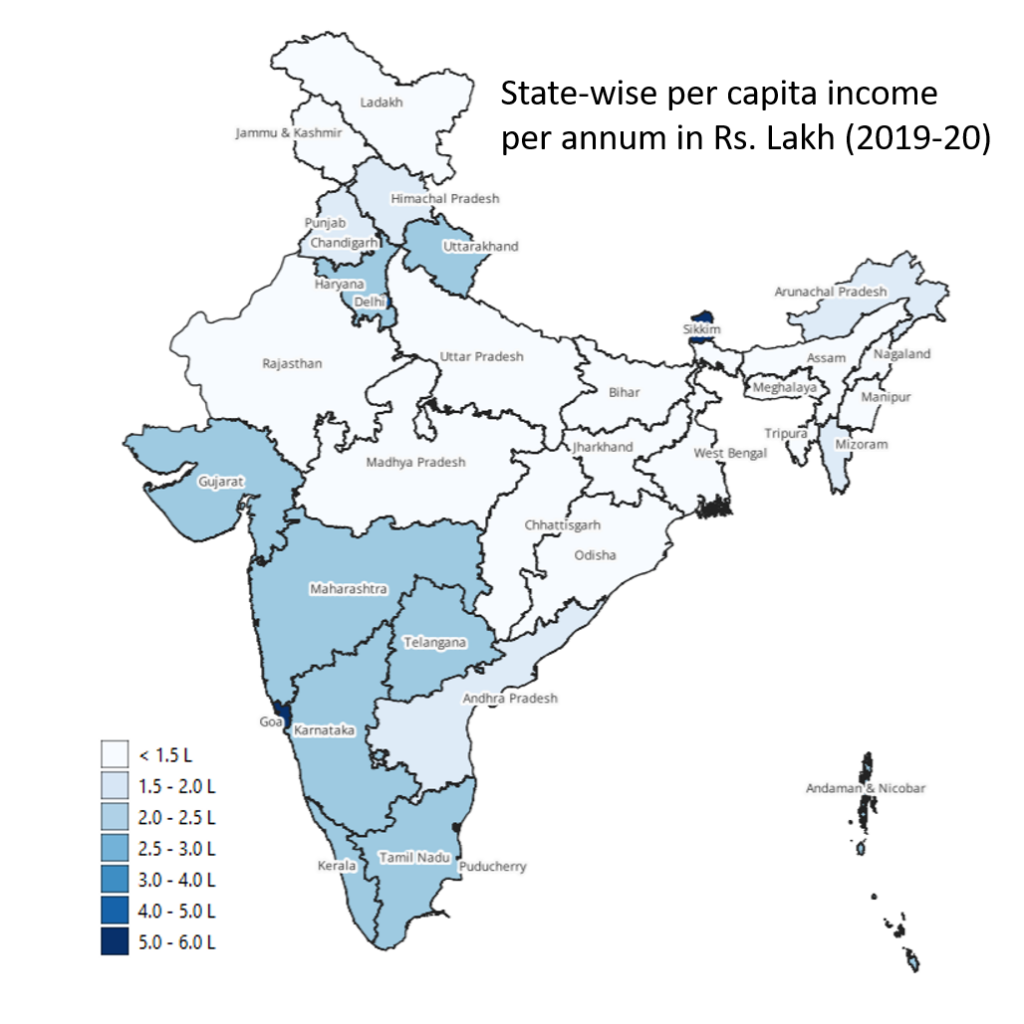
However, if Bengaluru Urban is excluded, the per-capita income drops by a whopping 27% to Rs. 1.62 lakhs. The ranking drops to 14th, just ahead of Punjab. Without counting its capital, the state even drops a category and ends up in the same league as Punjab, Andhra Pradesh and Arunachal Pradesh.
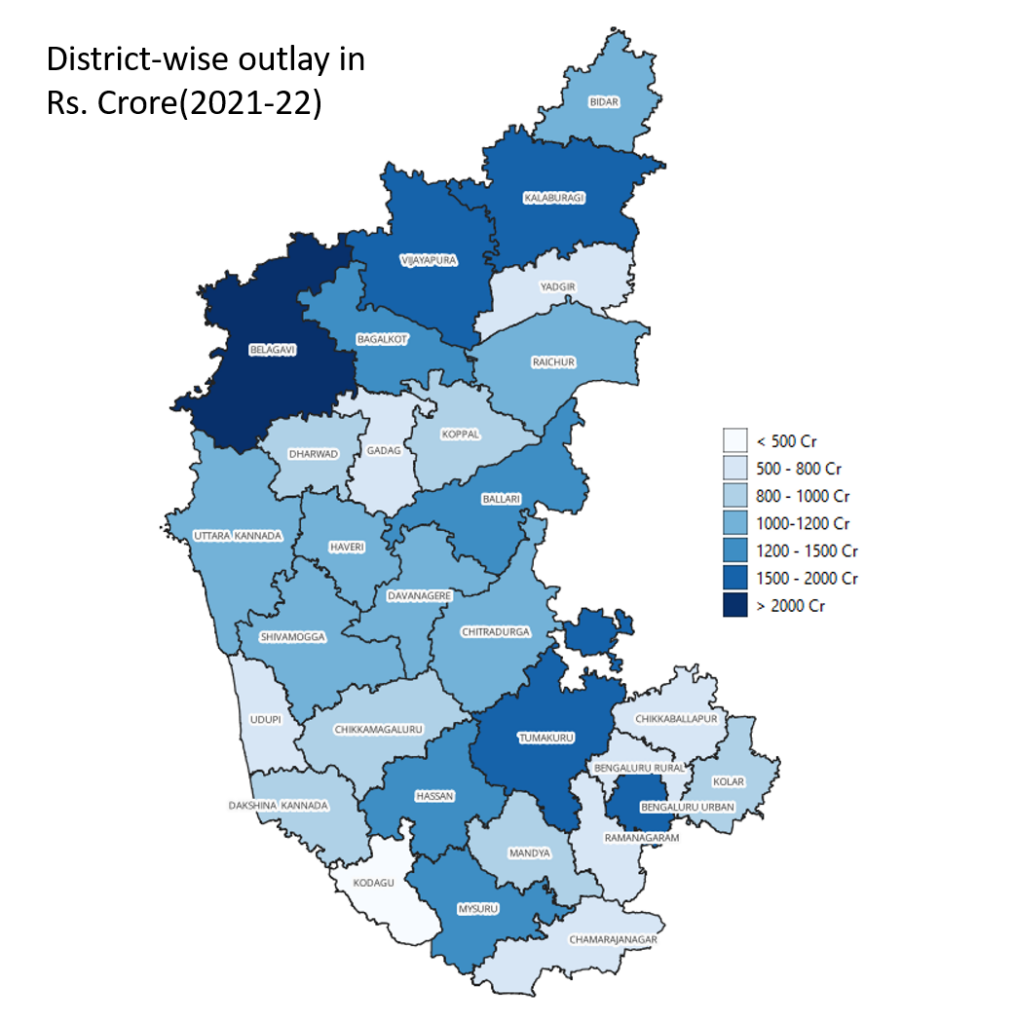
While Belagavi receives a whopping Rs. 2656 Cr and Bengaluru Urban, Tumakuru, Vijayapura and Kalaburgi districts garner a good share of the funds, other districts in North Karnataka don’t have much to look forward to. In fact, Yadgir and Gadag, two of the least developed districts of the state are among the bottom three districts in the outlay.
Given how the outlay does not seem to match the actual development needs of the state as identified by the Survey itself, it won’t come as a surprise when the next National Family Health Survey (NFHS) or Economic Survey is published to find these districts continuing to languish at the bottom.
You can access the Economic Survey document as well as csvs of important tables here.
(Note: The survey records data from 2019-20, and Vijayanagara district was not yet bifurcated from Ballari. The maps reflect the same.)